Physicians Practice is one of the leading websites for practice management. They’re not a recruitment firm so I was particularly interested to see the results of their new compensation survey hoping that bias would be kept to a minimum.
The survey comprises 1,766 responses from physicians. I’ve fleshed out the important stats you need to know. Overall, I’m happy that the respondents were well-rounded representing different kinds of practices, specialties, and years of experience. But I was pretty surprised at some of the salaries and most surprised by the number of hours worked. I thought the days of working residency type hours were over, but apparently not!
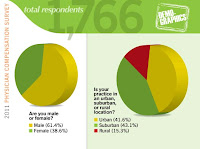
Practice location
- Urban – 41.6%
- Suburban – 43.1%
- Rural – 15.3%
Specialty
- Primary care – 38.5%
- Surgical & Specialist – 36.2%
- Psychiatry – 22.6%
- Other – 2.7%
Years in Experience
- Less than 5 years – 16.3%
- 5 to 10 years – 16.5%
- 11 to 15 years – 18.4%
- 16 to 20 years – 12.6%
- More than 20 years – 36.2%
Type of Practice
- Solo – 29.1%
- Group, 2 to 9 docs – 43.2%
- Group, 10 to 20 docs – 10.6%
- Group, 20+ docs – 17.1%
Salary (full time income with bonuses but not including insurance and other non-cash benefits)
- $100,000 or less – 15.3%
- $100,001 to $125,000 – 8.4%
- $125,001 to $150,000 – 11.7%
- $150,001 to $175,000 – 12.6%
- $175,001 to $200,000 – 15.8%
- $200,001 to $300,000 – 22.1%
- More than $300,000 – 14.1%
Hours of work per week
- 1 to 15 – 1.6%
- 16 to 30 – 5.6%
- 31 to 40 – 22.8%
- 41 to 60 – 48.8%
- 61 to 74 – 15.2%
- 75 or more – 6%
To see the rest of the statistics from the 2011 Physician Compensation Survey, click here.


